Happy New Year! Our January 2023 update containing data up to the 31st December 2022 is now available
Expanded to cover more of the UK property market
Welcome to our January 2023 property market update for the UK, featuring data up to December 31st, 2022. At Bricks&Logic, we're excited to announce that our data set has expanded to cover the entire England & Wales, with over 27 million properties now included in our assessments.
By logging in to our website, you can access our user-friendly heatmaps which highlight changes in property values over the past three months, providing a comprehensive overview of the UK property market.
England & Wales Update
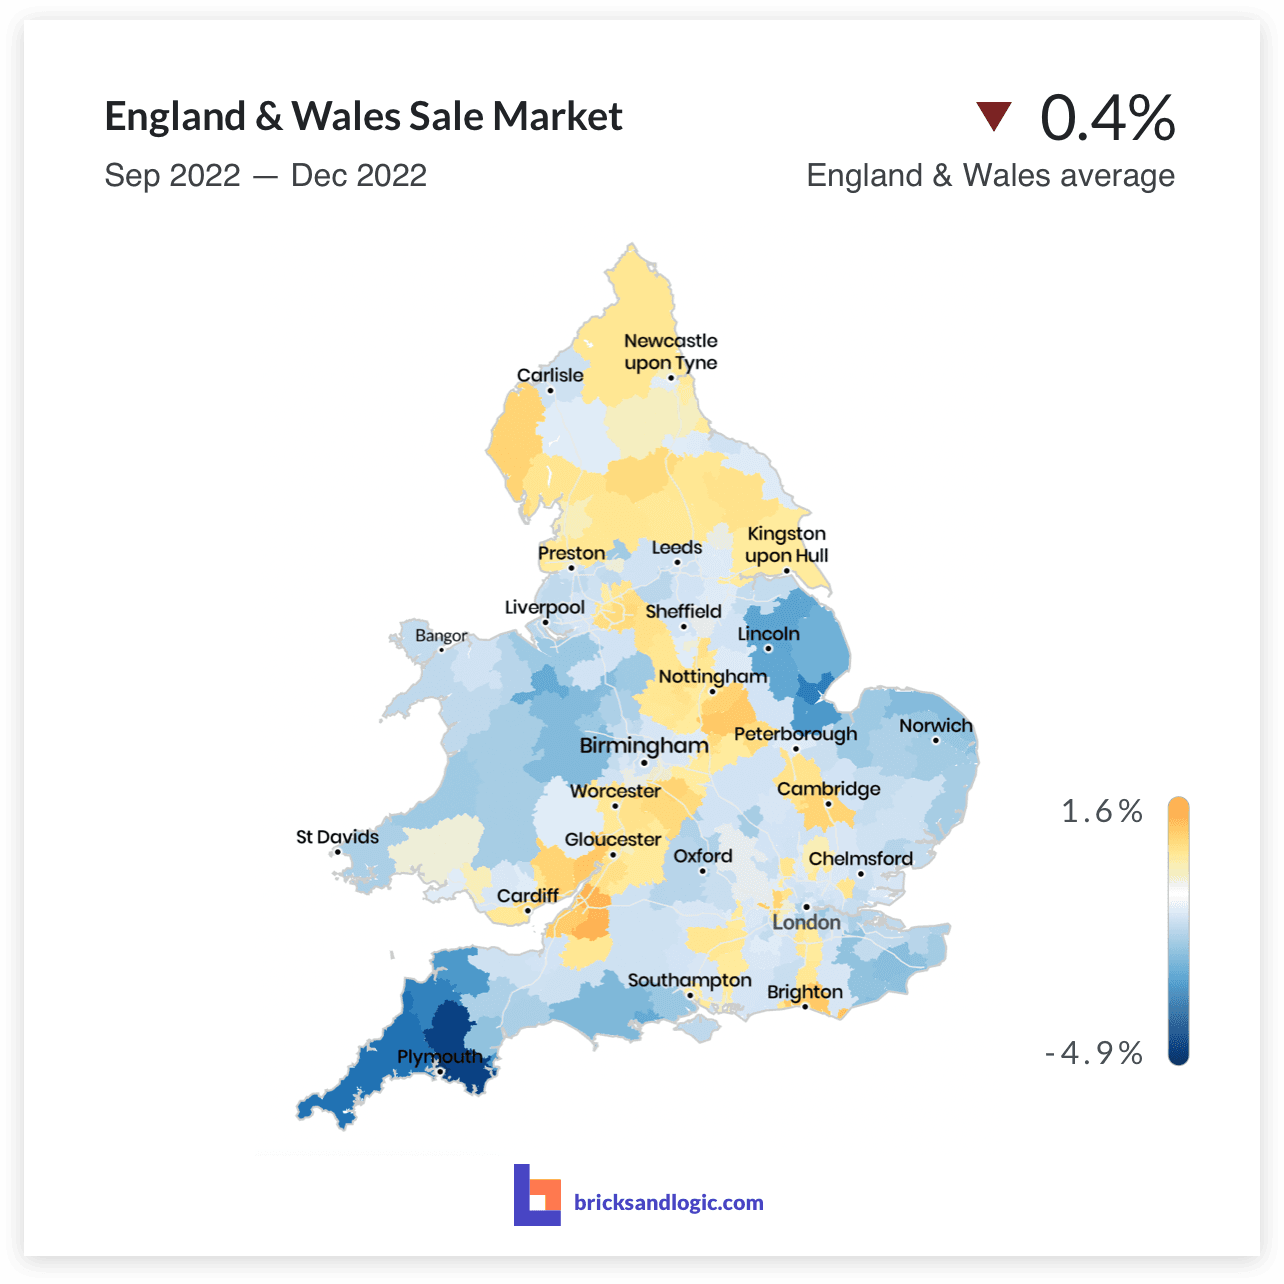
In terms of average sale values, across England & Wales, we've seen a slight decrease of 0.4% over the last quarter. However, it's worth noting that the South West region experienced a larger drop of nearly 5%.
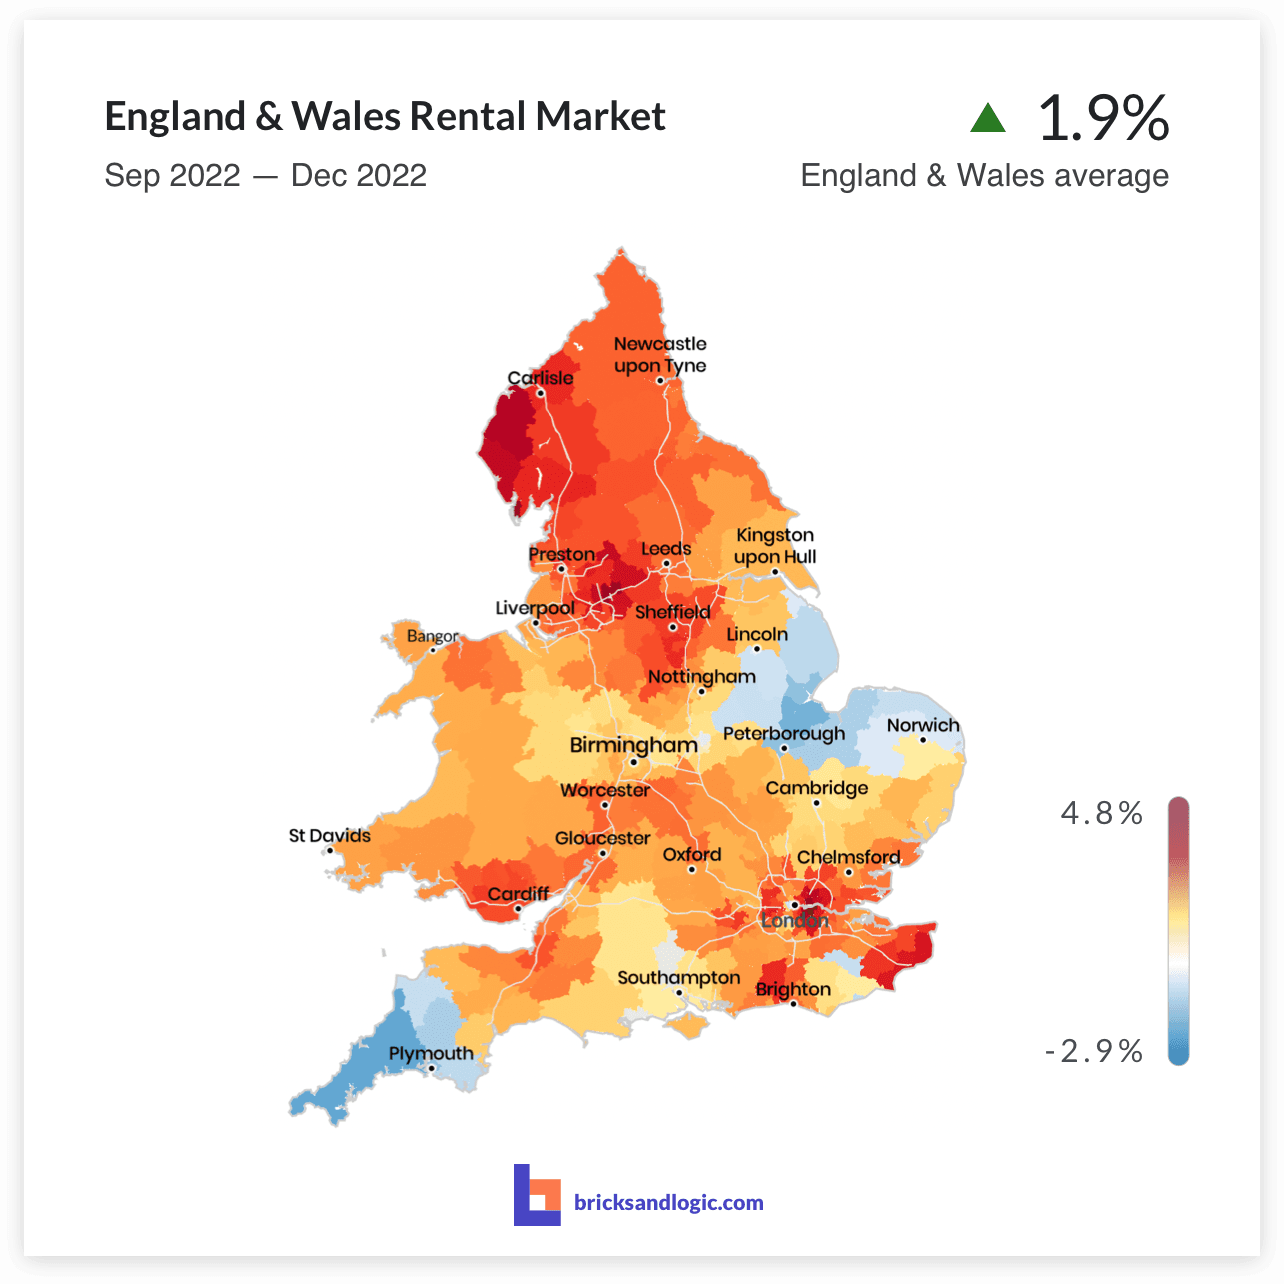
On the other hand, the average rental value has increased by 1.9% in the same period, with London and the North continuing to see strong growth.
London Update
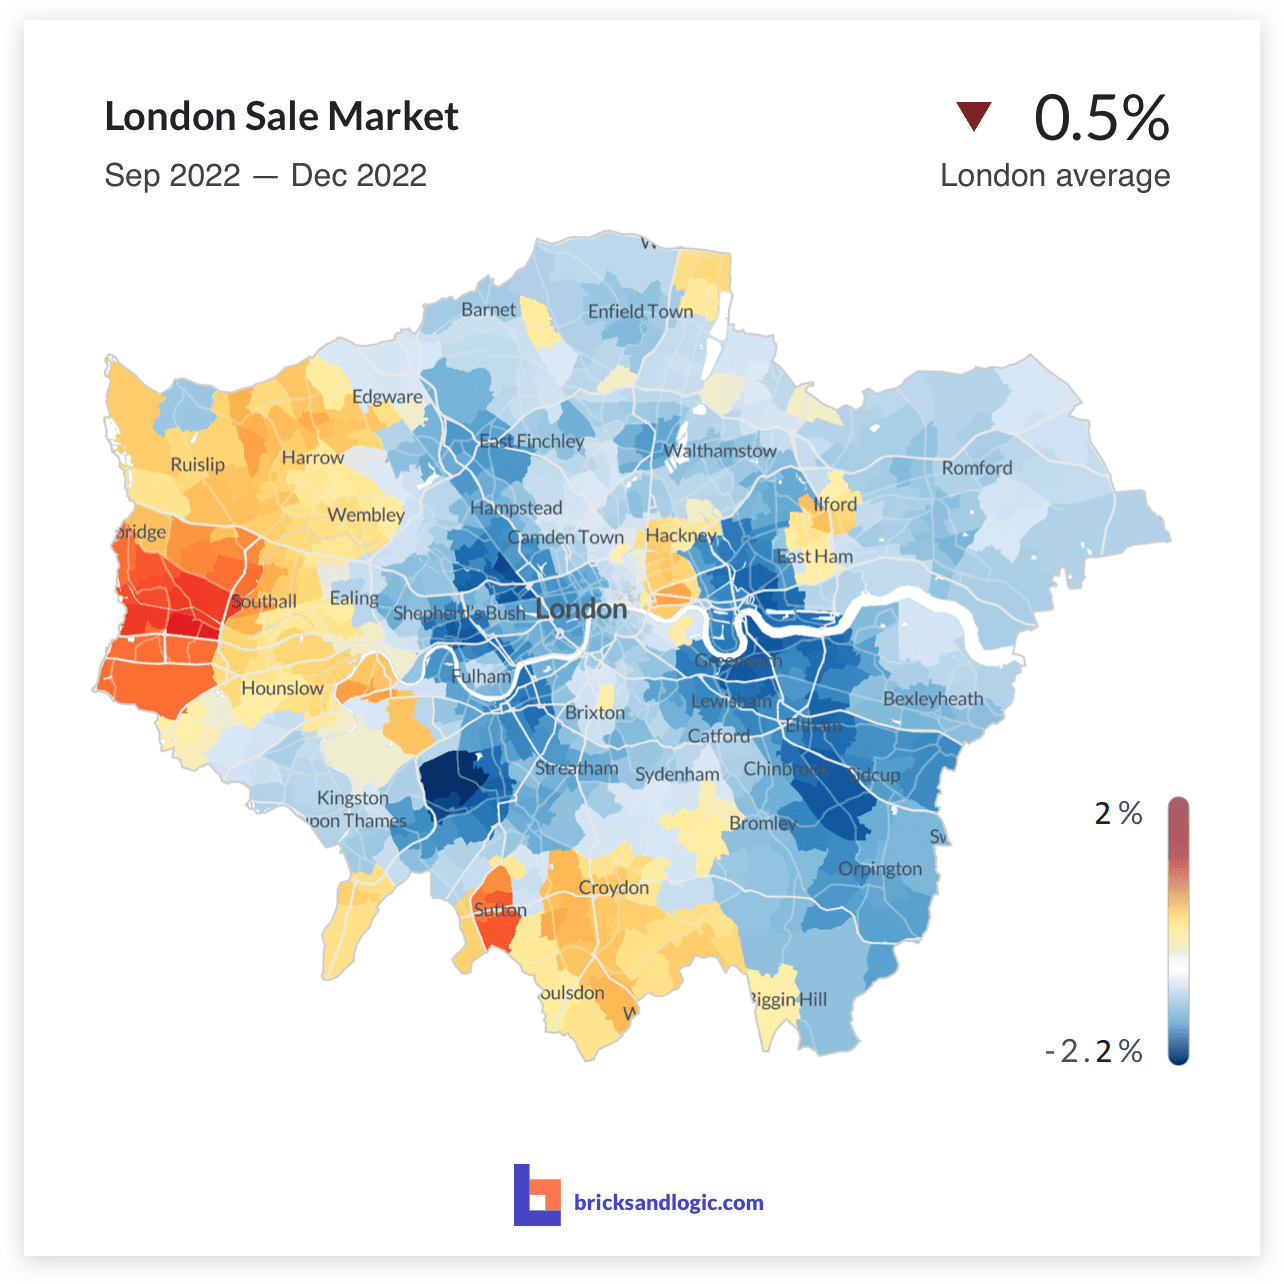
Looking specifically at London, we've seen a 0.5% decrease in average sale values over the past three months.
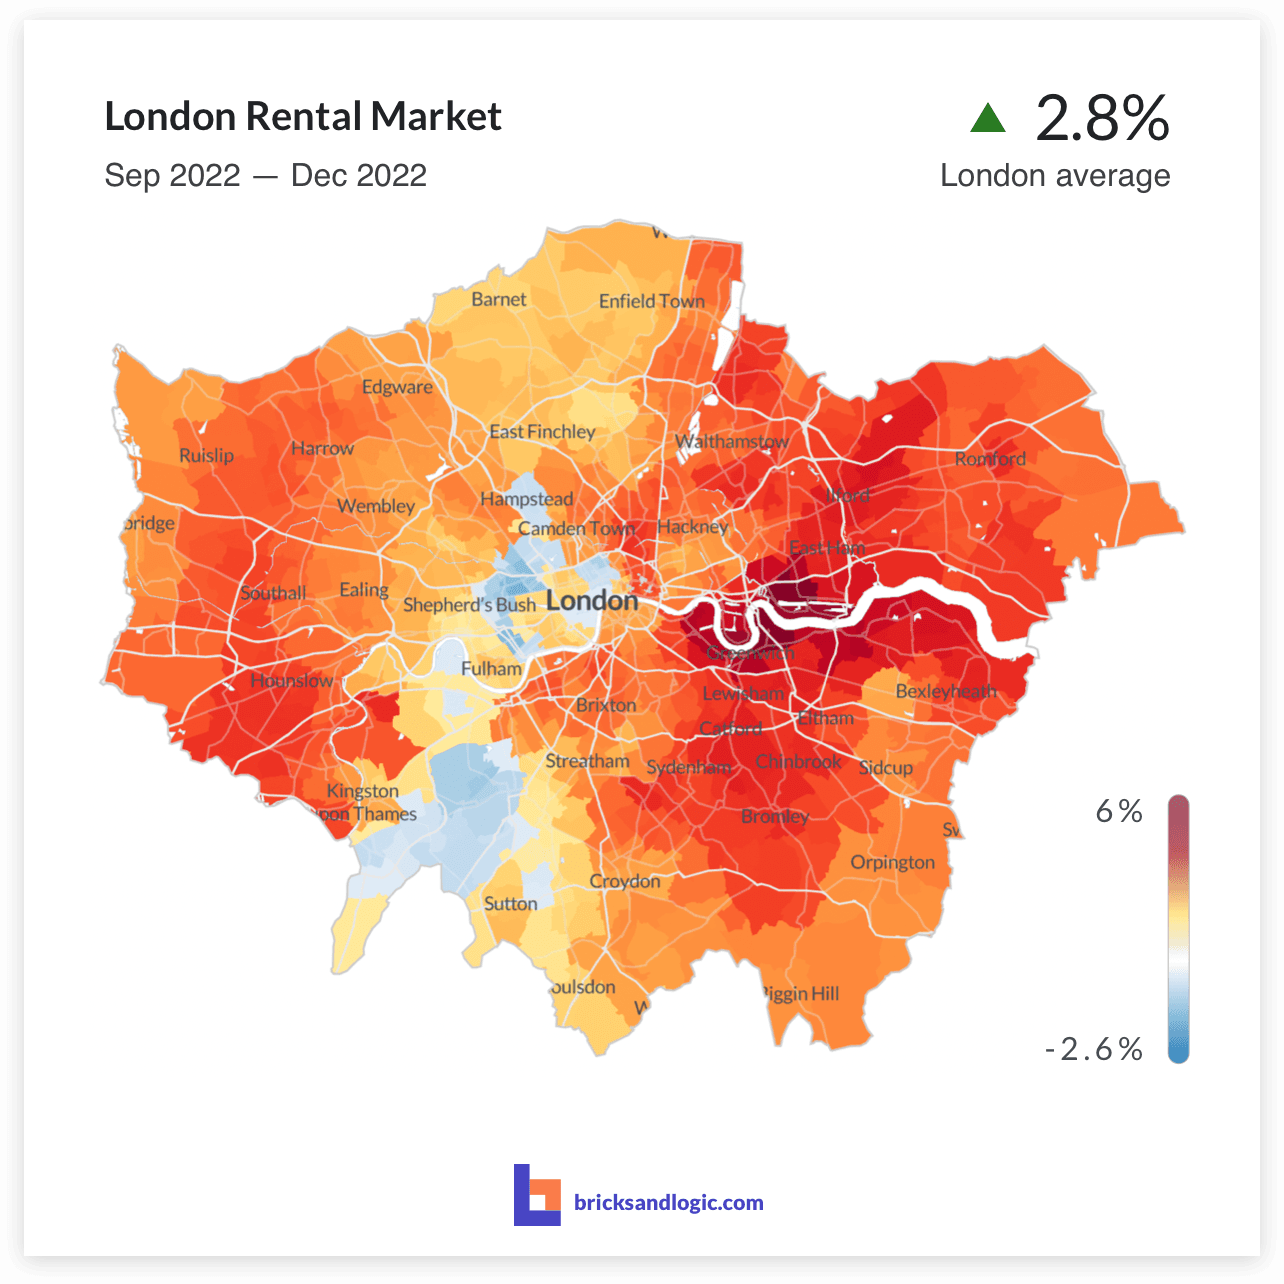
However, London's rental market remains robust, with strong growth across the city, particularly in the Docklands.
It's important to remember that these figures are averages, and different property types in the same location can perform differently.
To get a more accurate picture of how the market for your specific property has changed, we invite you to log in to our website and explore our maps.
As always, we appreciate your continued support and encourage you to follow us on our social media channels for the latest updates and insights in the UK property market.
- The Bricks&Logic Team