In this blog we look at how property pricing and changes varied substantially across different areas of London over the past decade.
2010 - 2012: Prime London recovers
In 2010, two years after the 2008 financial crash, with interest rates at an all-time low, the property market began to show signs of recovery. The traditionally sought-after areas of Central, West and South West London saw the greatest improvement with price increases in some cases approaching 30%, while less expensive areas such as East, South East and North East London saw much more modest increases of around 5%.
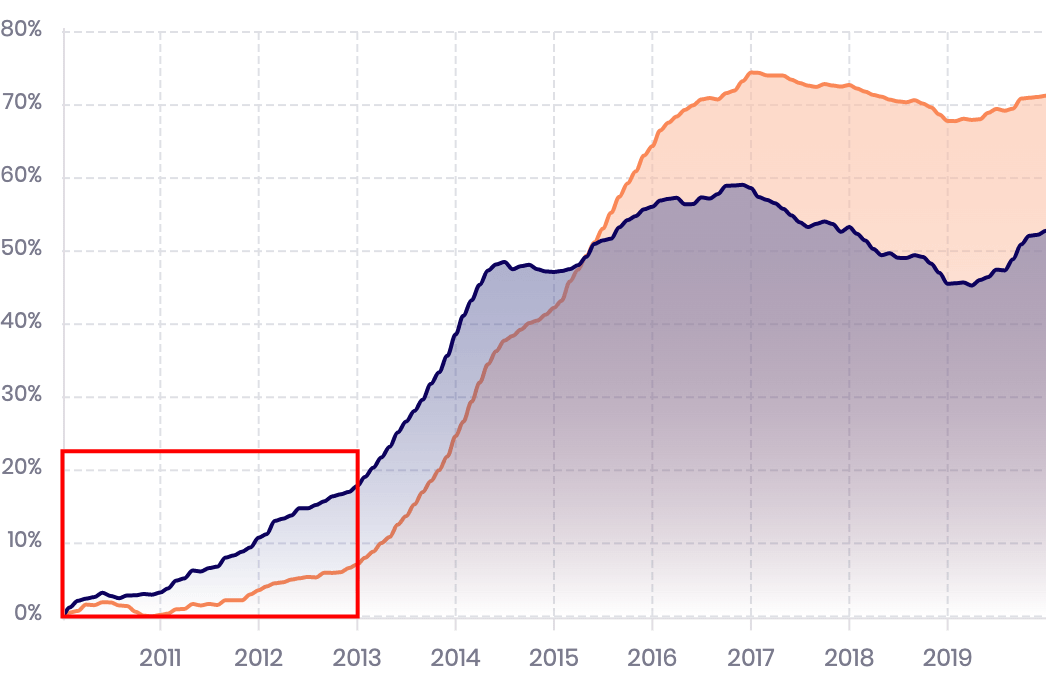
Expensive properties (Blue)
Cheapest properties (Orange)
2013 - 2015: Cheaper areas surge ahead
Between 2013 and 2015, huge price rises were observed in the cheaper areas of London, particularly in the East and South East - in some areas, property prices increased by almost 70%! Property prices in Central and West London continued to rise but at a much more modest rate and by early 2015 the cheaper areas overtook the more expensive in overall gains since 2010.
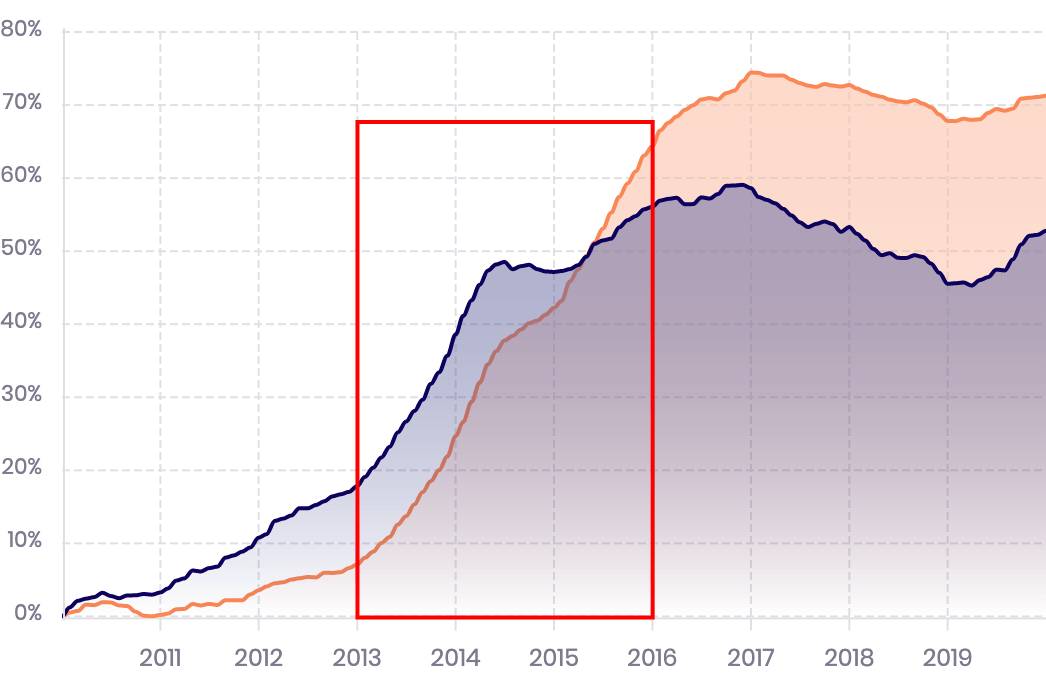
Expensive properties (Blue)
Cheapest properties (Orange)
2016 - 2018: The Brexit Years
In 2016, a series of events and policy decisions took place which would influence property prices for the next few years.
- Stamp duty was increased for property over £937,000
- An additional 3% levy was introduced for second homes
- Tax regulation became less favourable for ‘Buy to let’ investors
- The UK voted to leave the EU leading to a period of economic uncertainty
Between 2016 and 2018, the more expensive areas saw property prices decline by up to 10% and while the cheaper areas continued to rise through 2016, they too tailed off and began a modest decline in 2017 and through 2018.
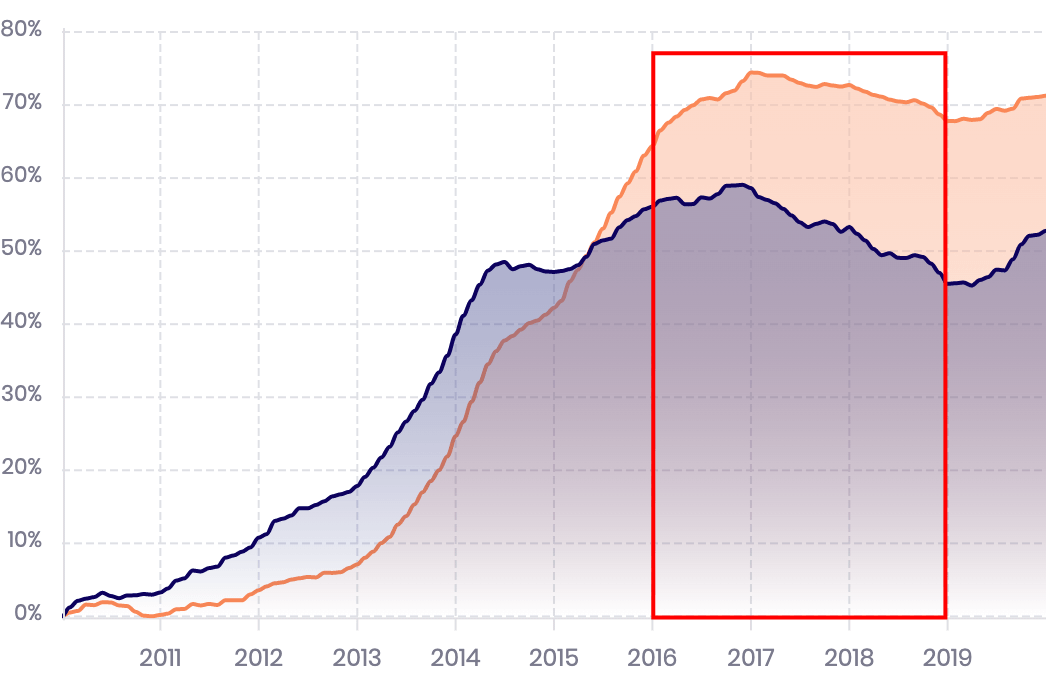
Expensive properties (Blue)
Cheapest properties (Orange)
2019: Recovery?
The dramatic price increases in the first half of the decade were followed by 5 years of overall decline, however there is some indication that this is beginning to change. The second half of 2019 saw price increases of up to 10% in some areas.
This may well have been influenced by politics as the Conservative Government gained a large majority, reducing if not eliminating Brexit related uncertainty and the risk of additional taxation on property owners.

Expensive properties (Blue)
Cheapest properties (Orange)
Edit - 2020: Covid-19
In March 2020, the UK entered lockdown in response to Covid-19. There is no property market at present as most, if not all, estate agents have effectively closed and property viewings are not taking place.
The Government has implemented a series of policies aiming to reduce the economic impact of the current lockdown.
The success of these policies will likely determine the state of the property market once the lockdown is lifted.
For a similar review of London rental prices check out this this blog post.