Looking at sale prices over time
What the average price doesn’t tell us
A quick google search returns lots of results for average property prices. In late 2019 , one of those results placed the average price of a flat in N1 at just over £600k. The only other piece of information given with this average was that it was based on a flat with 1.9 bedrooms.
Even if you’re willing to gloss over the ever so slightly incomplete second bedroom, it does get you thinking. What other characteristics does this ‘average’ flat have? What size is it? Does it have a balcony? What condition is it in? And how can I use this to compare prices across areas?
This is information that buyers and renters really want and need when choosing their next home.
The Bricks&Logic Index
We think that being able to quickly find the average price of a one bedroom 600sqft flat in good condition with a small terrace is infinitely more useful than knowing the valuation for an average 1.9 bedroom flat.
So we devised a tool that gives home-hunters genuine control over the property and locality characteristics being compared.
Using a whole host of smart data science and mathematical modeling techniques, we transformed all of the available data into outputs that allow you to compare apples with apples.
Now when you are comparing flat prices in different areas, you can easily compare the price of essentially the same flat in both areas rather than comparing an average containing mostly small ex-council flats with one containing mostly larger period flats with gardens.
Our take on things
Figure 1 shows the average price of a two bedroom 700sqft period flat in reasonable condition with no outside space in N1 and the average price of flats with the same characteristics across London since 2007.
For example in late 2019, the average price for this type of flat in N1 was £680,000 versus £560,000 for London as a whole.

Figure 2 demonstrates how much the price or this type of flat varies even within N1. In late 2019 for example, those in the cheapest parts of N1 were priced at £425,000, whereas those in the most expensive parts of N1 cost up to £1M.

How do we do this?
By deploying various statistical techniques we’re able to isolate the value of factors such as location and property characteristics (size, type etc).
We can then turn this process on its head and deconstruct prices to get a true representation of how they are changing over time. This way of doing things is far more accurate than simply working out the average of recorded Land Registry sale prices.
Two lines, two very different stories
Figure 3 shows how the Bricks&Logic Index for all flats in N1 (indicated by the blue line) compares to the average sale price per quarter for all flats as recorded in Land Registry data (indicated by the orange line).
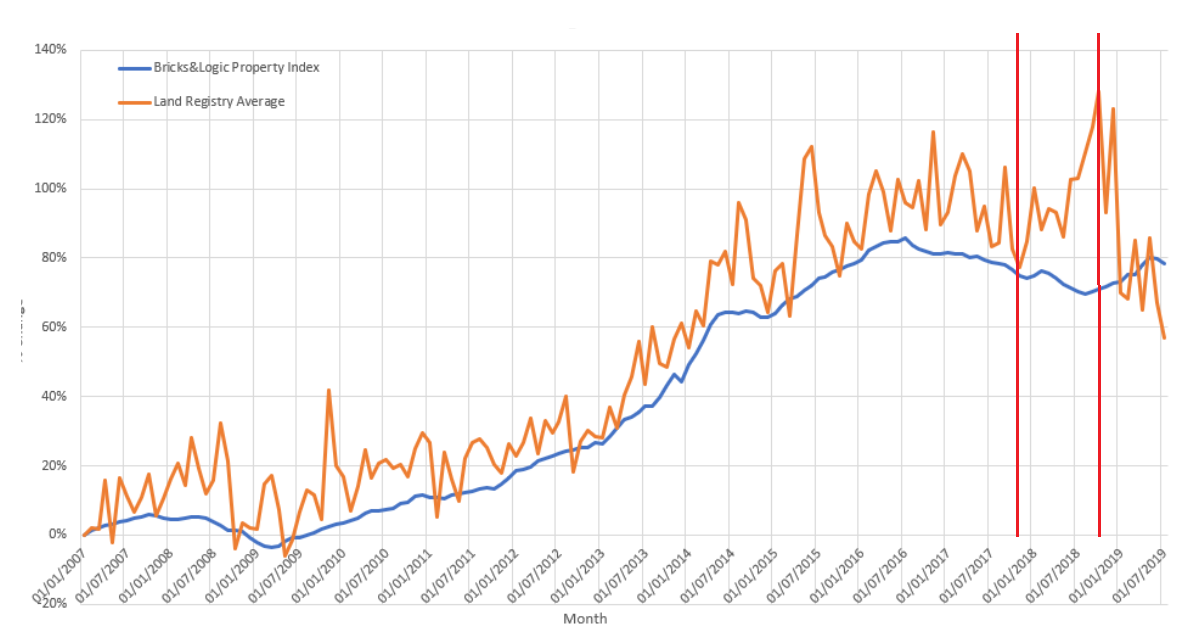
Looking only at the Land Registry average (orange line), the data suggests that between Q3 2017 and Q3 2018, prices increased from 78% to 125% of the Jan 2007 price. That’s an increase of over 25% in price in 18 months.
However, the Bricks&Logic Index (blue line) paints a rather different picture. Between Q3 2017 and Q3 2018, we show that prices actually fell by 4%!
Why such a disparity?
An average is a number expressing the central or typical value of a range. It is very useful for a number of things, but when comparing over time, it is important to understand if you are comparing an average of the same things.
This disparity between the Land Registry average and the Bricks&Logic Index can be explained by one or two things:
- More flats in expensive parts of N1 were sold through 2018 compared with previous periods
- A greater number of larger flats were sold than usual
Either way, a person looking at this information and assuming that the price of their own flat in N1 had increased by 25% would be in for an uncomfortable conversation with their estate agent when they put their property on the market to take advantage of this boom in prices!
The devil really is in the detail
As it happens, the reason behind the huge Land Registry average price increase was the sale of the majority of flats in three new-build luxury blocks. As well as being on the luxury end of the spectrum, many were also much larger than the average N1 flat.
Figure 4 illustrates this by counting the number of flats selling for over £1M in N1 over time.
Through 2016 and 2017, approximately 7% of all flat sales in N1 were for £1M or more. This jumps to 17% of sales in late 2018.

It’s not all onwards and upwards
Being able to move between micro and macro-level analysis has also allowed us to make some very interesting observations about how property prices have changed over time.
Property price movement differs significantly depending on where you are in London. Recovery from the 2008 recession was most striking in the more expensive areas of London (e.g. Kensington, Chelsea, Mayfair).
However by the end of 2013, the market in those areas had started to cool. Conversely, from 2013 onwards, property prices in the cheaper areas of London such as Sidcup and Grove Park started to dramatically increase in price.
And whilst we haven't seen significant price rises anywhere across the capital for the past couple of years, the expensive areas have actually seen a marked downturn since changes to Stamp Duty were introduced in April 2016 and Brexit began to dominate news headlines from June of that same year.

To sum it all up
We aren’t the only people using these sorts of data techniques, but we’re the only ones publishing information like this at a micro-level. And we believe that when it comes to finding your next home, this level of detail is invaluable.
It means your expectations aren’t thrown off-kilter by averages generated from different types of property and it allows you to search for direct comparisons rather than vague resemblances.
You no longer have to guess how much having an extra bedroom in E10 will add to the price - the Bricks&Logic Index was designed to work it out for you.
If you would like an instant sales or rental ‘Fair Price’ estimate for your property, Try it now!