Why haven’t rental prices increased as much as sale prices over the past decade?
Note - for a look how rental prices have changed since the pandemic see this blog
To get an online valuation and see how your property values have changed over time see our online valuation tool
With more and more people renting privately, rental prices have become as important as sales prices for many Londoners.
In this blog post, we are going to take a look at how rental prices have evolved over the past 10 years depending on which part of London you are in.
Rents Not Up As Much As Sale Prices Over the Last Decade
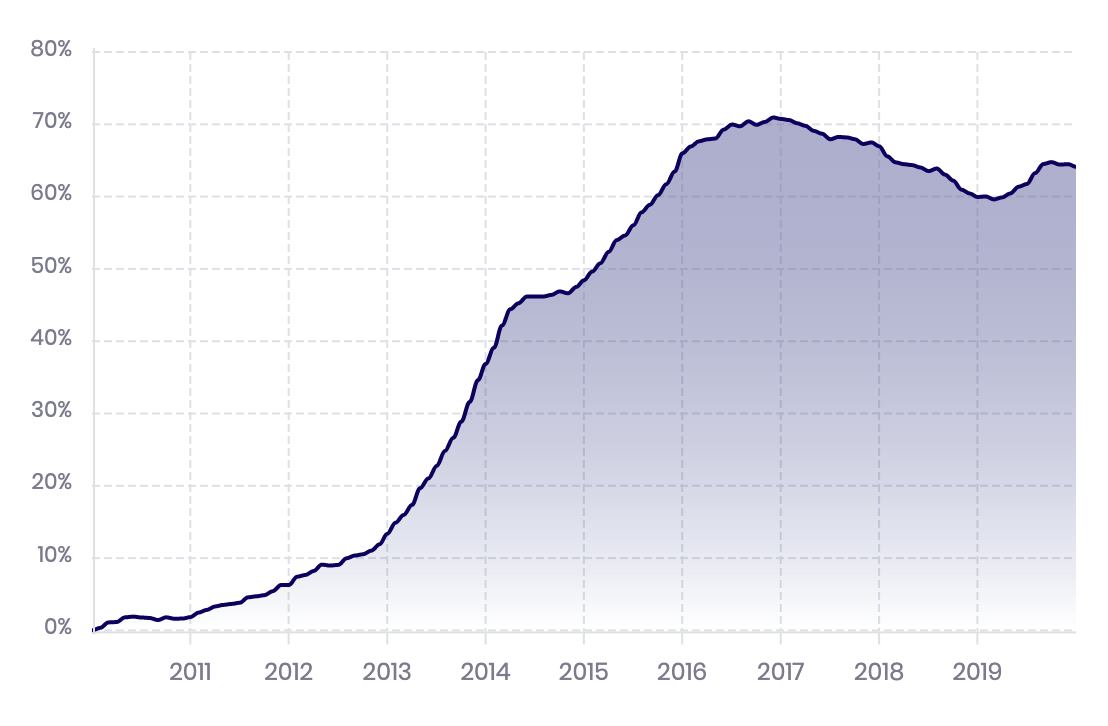
The Bricks&Logic Index shows that average rents across London increased by 38% in the past ten years (Figure 1).
If we compare this to inflation over the same period (26%), we have about a 12% increase in real terms.

Over the same period, the equivalent sales index is up 65% (Figure 2) or nearly 40% in real terms. Good news for property owners, but with the much smaller rental increases, bad news for buy-to-let investors.
Rents up much more in East London than South West
As you would expect given the diversity of the London housing stock, this movement has not been the same everywhere.
While the average increase across London was 38%, some areas have gone up by less than 20% and others by over 60%.
Areas in East London have seen rents rise far faster than those in the more expensive Central and South West areas (Figure 3).
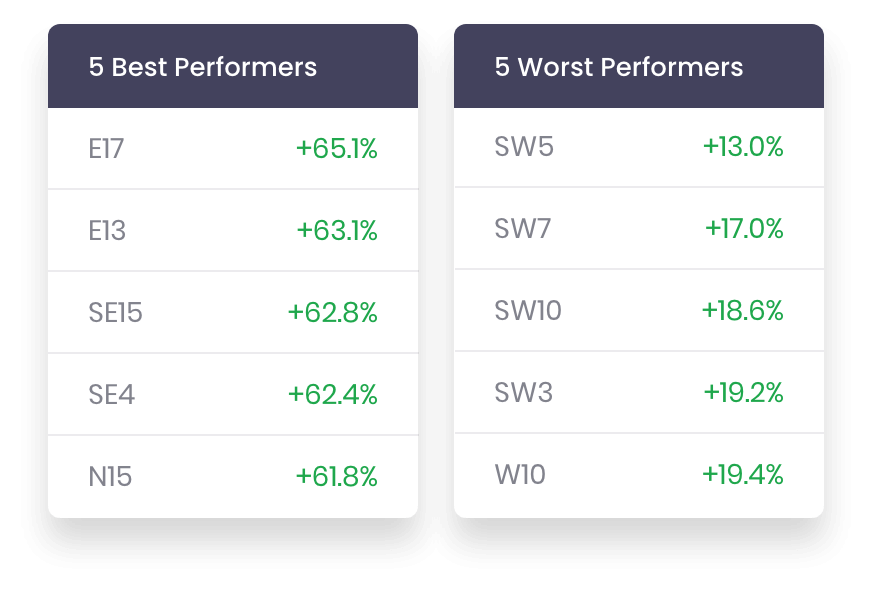
It is interesting to note that the average sale price of properties in the five biggest gaining areas is approximately £435,000, compared to over £1M for the five smallest gaining areas. It means that it is the rental prices for cheaper properties which have performed best over the past 10 years.
We can illustrate this further by looking at a chart of rental price evolution over the past decade in TfL zone 1 (average sale price of £875k) versus TfL zone 4 (average sale price of £440k) (Figure 4).

For a similar review of London sale prices check out this this blog post.